The post on IQ imbalance in transmitter, briefly discussed the effect of amplitude and phase imbalance and also showed that IQ imbalance results in spectrum at the image frequency. In this article, we will quantify the power of the image with respect to the desired tone (also known as IMage Rejection Ratio IMRR) for different values of gain and phase imbalance.
Continue reading “Image Rejection Ratio (IMRR) with transmit IQ gain/phase imbalance”Category: Analog
Describes about the analog blocks in the design
Modeling phase noise (frequency domain approach)
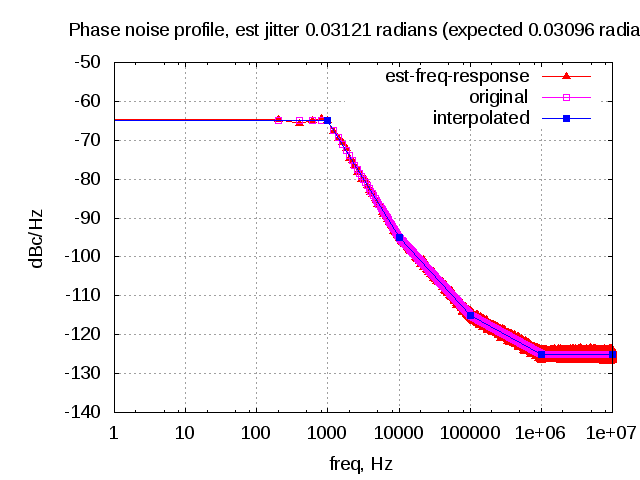
In typical wireless system simulations, there is a need to model the phase noise profile of the local oscillator. For eg, the phase noise profile of the oscillator can be of the shape described in the post on Phase Noise Power Spectral Density to Jitter. While looking around for example Matlab code, found two references [1, 2] which uses the approach of defining the phase noise profile in frequency domain, and then using ifft() to convert to the time domain samples. This post gives a brief overview of the modeling and provides an example Matlab/Octave code.
Continue reading “Modeling phase noise (frequency domain approach)”
Transmit spectrum with phase noise

The earlier posts on phase noise discussed about phase noise in oscillators, conversion of phase noise profile to jitter and the impact of phase noise on the error vector magnitude (evm). This post discuss the impact of phase noise on the spectrum of the transmit waveform. A simple random QPSK modulated symbols, oversampled and passed through a root raised cosine filtering is used for the simulation. Continue reading “Transmit spectrum with phase noise”
EVM with phase noise
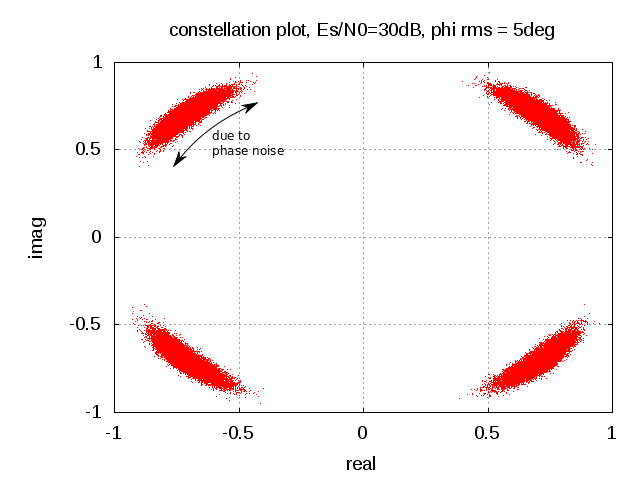
The previous post on phase noise discussed about finding the root mean square phase noise for a given phase noise profile. In this post let us discuss about the impact of phase noise on the error vector magnitude (evm) of a transmit symbol.
Phase noise power spectral density to Jitter
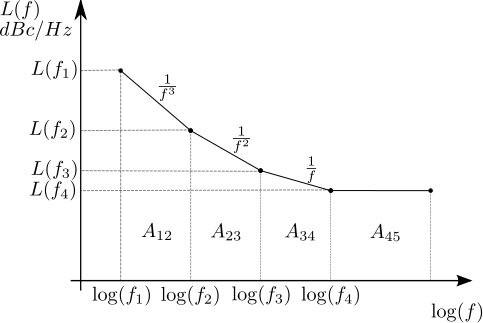
Following a brief discussion with my friend Mr. Rethnakaran Pulikkoonattu on phase noise profiles, he pointed me to his write up on Oscillator Phase Noise and Sampling Clock Jitter . In this post, we will discuss the math behind integrating the phase noise power spectral density (in dBc/Hz) to find the root mean square jitter value.
Continue reading “Phase noise power spectral density to Jitter”
Oscillator phase noise
Oscillators are used in typical radio circuits to drive the mixer used for the up-conversion or down-conversion of the passband transmission. Ideally, the spectrum of the oscillator is expected to have an impulse at the frequency of oscillation with no frequency components else where. However the spectrum of practical oscillators do have spectrum skirts around the oscillation frequency caused due to phase noise. This post discuss about the phase noise of oscillator and the metrics used to specify it.
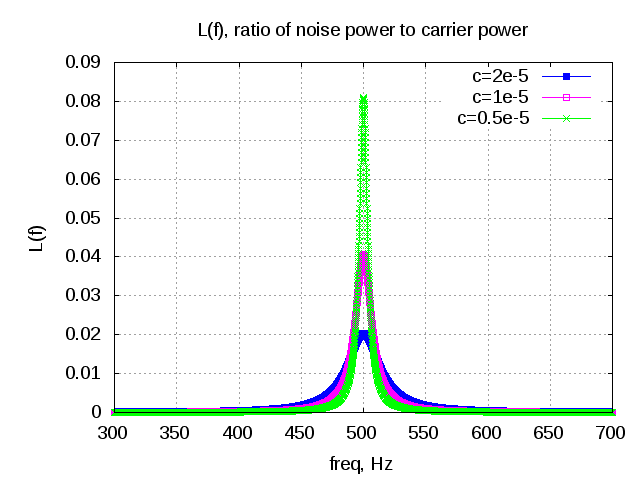
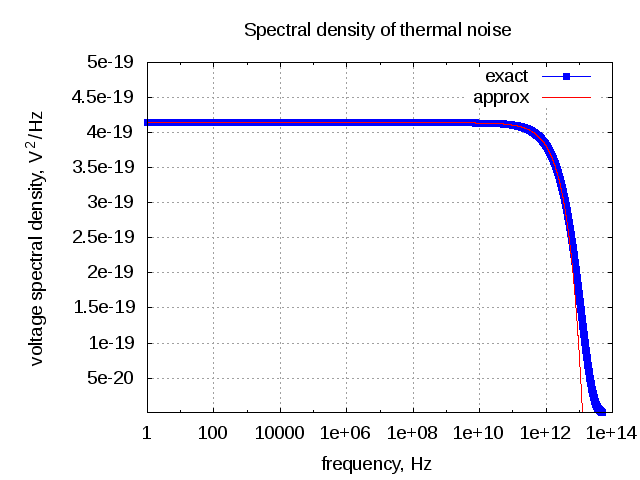
Thermal noise of RC low pass filter
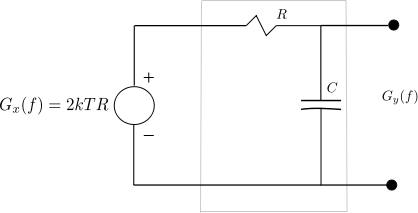
This post discuss about the thermal noise in RC low pass filter. Using the noise equivalent model using resistor with a voltage source, which gets passed through a no noise RC low pass filter. The noise power at the output is computed by integrating the output voltage spectral density over all frequencies.
Noise Figure of cascaded stages
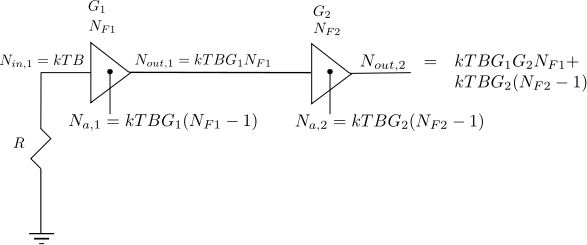
Following the discussion on thermal noise and it’s modeling and noise figure computation for a simple resistor network, in this article let us discuss the Noise Figure of cascaded stages.
Noise Figure of resistor network
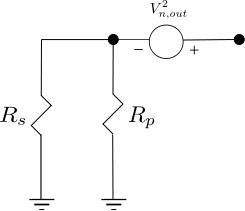
The post on thermal noise described the noise produced by resistor ohms over bandwidth
at temperature
Kelvin. In this post, let us define the noise voltage at the input and output of a resistor network and further use it to define the Noise Figure of such a network.
Thermal Noise and AWGN
A friend called me up couple of days back with the question – How white is AWGN? I gave him an answer over phone, which he was not too happy about. That got me thinking bit more on the topic and the result is this post – brief write up on thermal noise and it’s modelling as Additive White Gaussian Noise aka AWGN.
ADC SNR with clock jitter and quantization noise
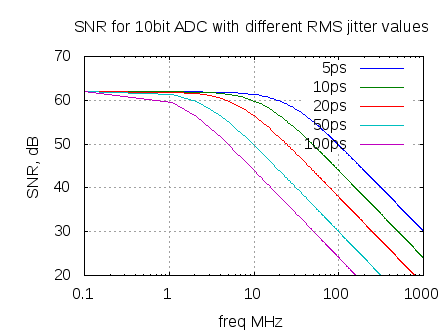
My friend and colleague Mr. Vineet Srivastava pointed me to a nice article on clock jitter – Clock Jitter Effects on Sampling : A tutorial – by Carlos Azeredo-Leme, IEEE Circuits and Systems Magazine, Third Quarter 2011. In this post, let us discuss the total Signal to Noise Ratio at the output of an analog to digital converter (ADC) accounting for errors due to sampling clock jitter and quantization noise.
Continue reading “ADC SNR with clock jitter and quantization noise”
IQ imbalance in transmitter
Typical communication systems use I-Q modulation and we had discussed the need for I-Q modulation in the past. In this post, let us understand I-Q imbalance and its effect on transmit signal.
IQ modulation and demodulation
Post describes about the need for I-Q modulation by comparing the spectral efficiency of passband PAM and passband QAM.
PAM (Pulse Amplitude Modulation) is one of the simplest ways to send digital data. In this post, we start with baseband PAM, look at its spectral efficiency, and then move on to passband PAM — which turns out to be less efficient. To fix that, we explore how QAM (Quadrature Amplitude Modulation) improves efficiency by using both sine and cosine carriers. This leads to I/Q modulation, and the corresponding IQ demodulation with Python code.
The content is based onSec 5.2.1 of [DIG-COMM-BARRY-LEE-MESSERSCHMITT].
Baseband PAM transmission
Consider a simple baseband transmission where the information is sent by modulating a pulse. This can be represented as
, where
is the symbol period,
is the symbol to transmit,
is the transmit pulse shaping filter,
is the symbol index and
is the output waveform.
Pictorially the same can be represented as,
Figure: Baseband PAM transmission
Minimum bandwidth for ISI free transmission
According to the Nyquist zero ISI criterion, to transmit data without intersymbol interference (ISI), the pulse shaping filter must satisfy,
This ensures that each symbol appears cleanly at its own sampling instant without interference from neighboring symbols. For this condition to hold and still remain bandlimited to , the ideal pulse shape is the sinc function:
This result comes from the fact that, with ideal sinc pulse shaping, the entire symbol stream can be perfectly reconstructed if the channel passes all frequencies up to . This is also consistent with the Nyquist–Shannon sampling theorem, which states that to fully reconstruct a signal sampled at
, the signal must be bandlimited to
.
Thus, if we use ideal (bandlimited) pulses like sinc functions, the entire baseband PAM signal can be confined within:
Figure: Spectrum of baseband PAM (with symbol rate )
Spectral Efficiency
Spectral efficiency is a measure of how efficiently a communication system transmits data over a given bandwidth. It is defined as the number of bits transmitted per second per unit bandwidth, typically expressed in bits/second/Hertz.
Assuming that PAM signal uses
distinct amplitude levels, each symbol carries
bits. When each symbol takes
seconds to transmit, the bit rate of the system is:
Substituting the bit rate and bandwidth into the formula for spectral efficiency, we get the spectral efficiency of baseband PAM as.
Code
Python code for passband PAM transmission with pulse shaping by rectangular filter and sinc filter.
Passband PAM transmission
Now, consider that the baseband PAM signal is upconverted to a carrier frequency by multiplication by a cosine carrier. The transmitted passband signal is:
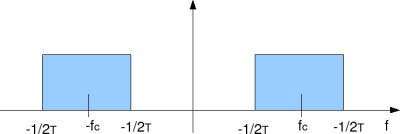
The spectrum of the passband PAM is as shown below,
Figure: Spectrum of passband PAM
When the baseband signal is multiplied by , this modulation shifts the entire spectrum up to be centered around the carrier frequency
.
The frequency range of the signal becomes:
Thus, the total bandwidth needed by passband PAM is,
Spectral Efficiency of passband PAM
As earlier, assuming that PAM signal uses
distinct amplitude levels, each symbol carries
bits. When each symbol takes
seconds to transmit, the bit rate of the system is:
Substituting the bit rate and bandwidth into the formula for spectral efficiency, we get the spectral efficiency of passband PAM as,
Can see that spectral efficiency of passband PAM is half of baseband PAM.
IQ Modulation (QAM for improving spectral efficiency)
As seen earlier, passband PAM suffers from reduced spectral efficiency. To improve spectral efficiency, we exploit the orthogonality of sine and cosine carriers. This leads to Quadrature Amplitude Modulation (QAM), where two independent data streams are modulated:
- to a cosine wave (in-phase component, I)
- to a sine wave (quadrature component, Q)
Because sine and cosine are orthogonal over a symbol period , these two streams do not interfere and can be perfectly separated at the receiver. As a result, QAM doubles the data rate over the same bandwidth compared to passband PAM.
The transmit signal with passband QAM is represented as,
where,
and
are the in-phase and quadrature data symbols, respectively
is the carrier frequency
This signal requires the same bandwidth as passband PAM, however carries twice the information.
Note :
The factor of is included to normalize the total power of the passband QAM signal to unity. As cosine and sine carriers each contribute only half the power
when modulating a baseband signal, multiplying each arm by
ensures that the modulated in-phase and quadrature components retain their original baseband power.
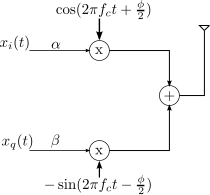
For notational convenience, we express the passband signal using its complex baseband equivalent,
,
where
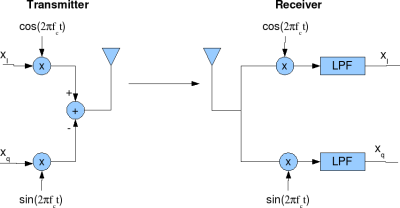
This forms the I-Q modulator circuit.
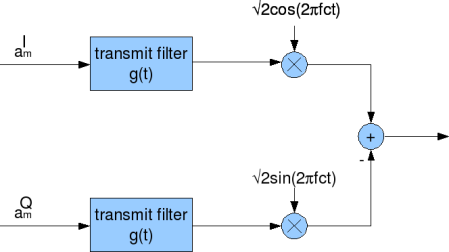
Figure: IQ modulator
IQ demodulation
The received passband signal is split into two branches and multiplied with cosine (in-phase, I) and sine (quadrature, Q) carriers. Each branch is then passed through a matched low-pass filter, typically matched to the transmit pulse shape, to extract the baseband I and Q components. The resulting streams are then independently sampled and demodulated to recover the transmitted symbols.
Downconversion
Let the received passband signal
where,
To extract the I and Q signals, multiply with local carrier signals :
In-phase branch:
Similarly, for the quadrature branch:
After downconversion, each branch (I and Q) contains the desired baseband signal components, along with unwanted high-frequency terms centered around .
Low-pass Filtering
To isolate the desired baseband signals, we apply a low-pass filter (LPF) to both the I and Q branches. This filter passes frequencies within the baseband bandwidth (usually where
Matched Filtering
After low-pass filtering, we apply a matched filter to each of the I and Q branches. The matched filter is designed to maximize the signal-to-noise ratio (SNR) at the symbol sampling instants. It is typically a time-reversed and conjugated version of the transmit pulse shape .
If the transmit pulse was a rectangular or truncated sinc or raised-cosine shape, the matched filter is also a rectangular or truncated sinc or raised-cosine, respectively. This ensures:
- Maximum energy concentration at symbol instants
- Minimization or elimination of inter-symbol interference (ISI)
The output of the matched filter is then sampled every and
.
This sequence completes the demodulation chain for QAM and ensures that both spectral shaping and ISI suppression are achieved in the receiver.
The IQ demodulator can be visualized as shown in the figure below
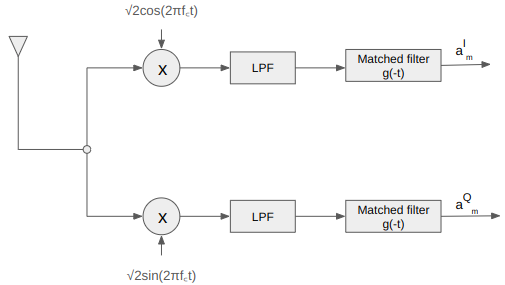
Figure: IQ demodulator
Code
Python code for passband qam with rectangular and sinc pulse shaping filter, followed by low pass filtering and matched filtering.
When compared to the transmit symbols, can see that there is a spread in the received symbols. Using raised cosine or root raised cosine filters is a potential approache to mitigate this.
Summary
The post covers the following key aspects
- Spectrum of Baseband PAM with a code example
- Reduced Spectral Efficiency of Passband PAM
- Sending information on orthogonal sine and cosine carriers to improve efficiency (passband QAM)
- IQ modulator and corresponding demodulator for Passband QAM with code
Another approach for improving the spectral efficiency of passband PAM is to filter away half the bandwidth (which is not carrying any ‘extra’ information). This is called Single Sideband Modulation (SSB). Anyhow, as I-Q modulation is simpler to implement than circuit for filtering away half the spectrum, I-Q modulation stays. 🙂
Have any questions or feedback? Feel free to drop your feedback in the comments section. 🙂
Reference
[DIG-COMM-BARRY-LEE-MESSERSCHMITT] Digital Communication: Third Edition, by John R. Barry, Edward A. Lee, David G. Messerschmitt
2nd order sigma delta modulator
In a previous post, the variance of the in-band quantization noise for a first order sigma delta modulator was derived. Taking it one step furhter, let us find the variance of the quantization noise filtered by a second order filter.
With a first order filter, the quantization noise passes through a system with transfer function (Refer Eq. 9.2.17 in [1]). The frequency response of
is
(Refer Eq. 9.2.18 in [1]).