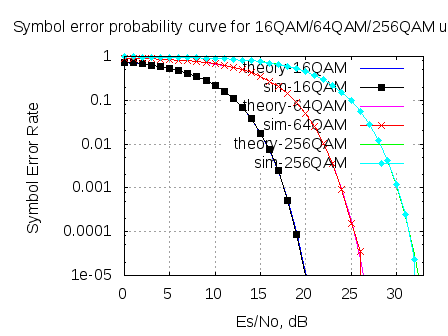
In May 2008, we derived the theoretical symbol error rate for a general M-QAM modulation (in Embedded.com, DSPDesignLine.com and dsplog.com) under Additive White Gaussian Noise. While re-reading that post, felt that the article is nice and warrants a re-run, using OFDM as the underlying physical layer. This post discuss the derivation of symbol error rate for a general M-QAM modulation. The companion Matlab script compares the theoretical and the simulated symbol error rate for 16QAM, 64QAM and 256QAM over OFDM in AWGN channel.
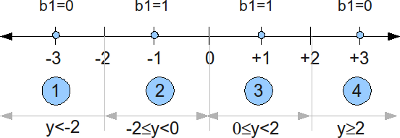
In the post on Soft Input Viterbi decoder, we had discussed BPSK modulation with convolutional coding and soft input Viterbi decoding in AWGN channel. Let us know discuss the derivation of soft bits for 16QAM modulation scheme with Gray coded bit mapping. The channel is assumed to be AWGN alone.
We have quite a few articles discussing bit and symbol error rates for popular digital modulation schemes in Additive White Gaussian Noise (AWGN) channel. This post summarizes the articles discussing the theoretical and simulatederror rates for the digital modulation schemes like BPSK, QPSK, 4–PAM, 16PSK and16QAM. Further, Bit Error Rate with Gray coded mapping, bit error rate for BPSK over OFDM are also discussed.
The links to the individual articles and the Matlab/Octavesimulation models are listed below. Alternatively, I have made a e-book discussing all the below mentioned articles to a single PDF file. If you wish, you can download the free e-book by subscribing to the free email newsletter.
I have written another article in DSPDesginLine.com. This article can be treated as the third post in the series aimed at understanding Shannon’s capacity equation.
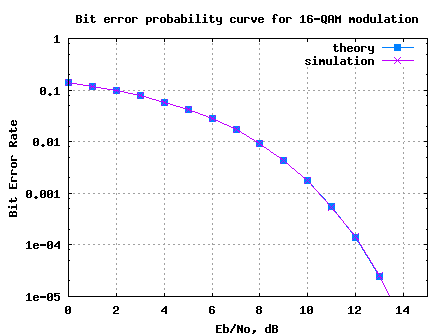
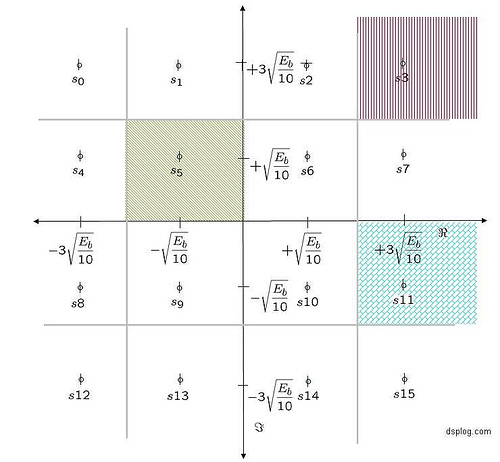
Let us derive the theoretical 16QAM bit error rate (BER) with Gray coded constellation mapping in additive white Gaussian noise conditions. Further, the Matlab/Octave simulation script can be used to confirm that the simulation is in good agreement with theory.
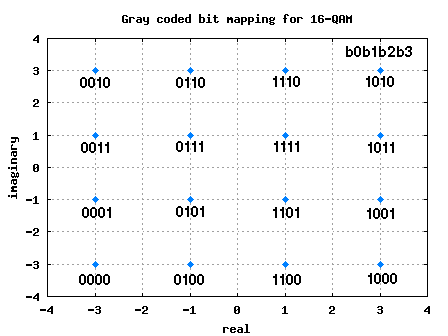
In the previous post on Binary to Gray code conversion for PSK, I had claimed that “for a general M-QAM modulation the binary to Gray code conversion is bit more complicated“. However following a closer look, I realize that this is not so complicated. 🙂
The QAM scenario can be treated as independent PAM modulation on I arm and Q-arm respectively. For example, let us consider 16-QAM scenario.
Its been a nice week for me, wherein I guest posted an article in DSPDesignLine.com. 🙂
The article derives the theoretical symbol error rate for M-QAM modulation. The theoretical results are further supplemented by Matlab/Octave simulation scripts.
Post describes about the need for I-Q modulation by comparing the spectral efficiency of passband PAM and passband QAM.
PAM (Pulse Amplitude Modulation) is one of the simplest ways to send digital data. In this post, we start with baseband PAM, look at its spectral efficiency, and then move on to passband PAM — which turns out to be less efficient. To fix that, we explore how QAM (Quadrature Amplitude Modulation) improves efficiency by using both sine and cosine carriers. This leads to I/Q modulation, and the corresponding IQ demodulation with Python code.
Consider a simple baseband transmission where the information is sent by modulating a pulse. This can be represented as
, where
is the symbol period,
is the symbol to transmit,
is the transmit pulse shaping filter,
is the symbol index and
is the output waveform.
Pictorially the same can be represented as,
Figure: Baseband PAM transmission
Minimum bandwidth for ISI free transmission
According to the Nyquist zero ISI criterion, to transmit data without intersymbol interference (ISI), the pulse shaping filter must satisfy,
This ensures that each symbol appears cleanly at its own sampling instant without interference from neighboring symbols. For this condition to hold and still remain bandlimited to, the ideal pulse shape is the sinc function:
This result comes from the fact that, with ideal sinc pulse shaping, the entire symbol stream can be perfectly reconstructed if the channel passes all frequencies up to . This is also consistent with the Nyquist–Shannon sampling theorem, which states that to fully reconstruct a signal sampled at , the signal must be bandlimited to .
Thus, if we use ideal (bandlimited) pulses like sinc functions, the entire baseband PAM signal can be confined within:
Figure: Spectrum of baseband PAM (with symbol rate )
Spectral Efficiency
Spectral efficiency is a measure of how efficiently a communication system transmits data over a given bandwidth. It is defined as the number of bits transmitted per second per unit bandwidth, typically expressed in bits/second/Hertz.
Assuming that PAM signal uses distinct amplitude levels, each symbol carries bits. When each symbol takes seconds to transmit, the bit rate of the system is:
Substituting the bit rate and bandwidth into the formula for spectral efficiency, we get the spectral efficiency of baseband PAM as.
Code
Python code for passband PAM transmission with pulse shaping by rectangular filter and sinc filter.
Passband PAM transmission
Now, consider that the baseband PAM signal is upconverted to a carrier frequency by multiplication by a cosine carrier. The transmitted passband signal is:
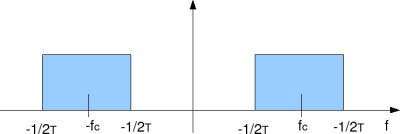
The spectrum of the passbandPAM is as shown below,
Figure: Spectrum of passband PAM
When the baseband signal is multiplied by , this modulation shifts the entire spectrum up to be centered around the carrier frequency .
The frequency range of the signal becomes:
Thus, the total bandwidth needed by passband PAM is,
Spectral Efficiency of passband PAM
As earlier, assuming that PAM signal uses distinct amplitude levels, each symbol carries bits. When each symbol takes seconds to transmit, the bit rate of the system is:
Substituting the bit rate and bandwidth into the formula for spectral efficiency, we get the spectral efficiency of passband PAM as,
Can see that spectral efficiency of passband PAM is half of baseband PAM.
IQ Modulation (QAM for improving spectral efficiency)
As seen earlier, passband PAM suffers from reduced spectral efficiency. To improve spectral efficiency, we exploit the orthogonality of sine and cosine carriers. This leads to Quadrature Amplitude Modulation (QAM), where two independent data streams are modulated:
to a cosine wave (in-phase component, I)
to a sine wave (quadrature component, Q)
Because sine and cosine are orthogonal over a symbol period, these two streams do not interfere and can be perfectly separated at the receiver. As a result, QAM doubles the data rate over the same bandwidth compared to passband PAM.
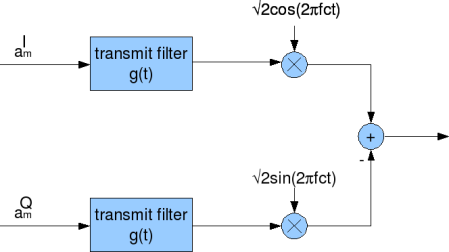
The transmit signal with passband QAM is represented as,
where,
and are the in-phase and quadrature data symbols, respectively
is the transmit pulse shaping filter, and
is the carrier frequency
This signal requires the same bandwidth as passband PAM, however carries twice the information.
Note :
The factor of is included to normalize the total power of the passband QAM signal to unity. As cosine and sine carriers each contribute only half the power when modulating a baseband signal, multiplying each arm by ensures that the modulated in-phase and quadrature components retain their original baseband power.
For notational convenience, we express the passband signal using its complex baseband equivalent,
,
where
This forms the I-Q modulator circuit.
Figure: IQ modulator
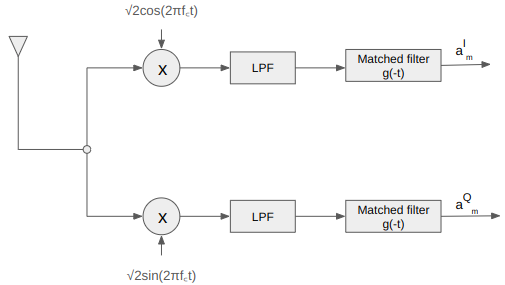
IQ demodulation
The received passband signal is split into two branches and multiplied with cosine (in-phase, I) and sine (quadrature, Q) carriers. Each branch is then passed through a matched low-pass filter, typically matched to the transmit pulse shape, to extract the baseband I and Q components. The resulting streams are then independently sampled and demodulated to recover the transmitted symbols.
Downconversion
Let the received passband signal
where,
To extract the I and Q signals, multiply with local carrier signals :
In-phase branch:
Similarly, for the quadrature branch:
After downconversion, each branch (I and Q) contains the desired baseband signal components, along with unwanted high-frequency terms centered around .
Low-pass Filtering
To isolate the desired baseband signals, we apply a low-pass filter (LPF) to both the I and Q branches. This filter passes frequencies within the baseband bandwidth (usually where is the symbol period .
Matched Filtering
After low-pass filtering, we apply a matched filter to each of the I and Q branches. The matched filter is designed to maximize the signal-to-noise ratio (SNR) at the symbol sampling instants. It is typically a time-reversed and conjugated version of the transmit pulse shape .
If the transmit pulse was a rectangular or truncated sinc or raised-cosine shape, the matched filter is also a rectangular or truncated sinc or raised-cosine, respectively. This ensures:
Maximum energy concentration at symbol instants
Minimization or elimination of inter-symbol interference (ISI)
The output of the matched filter is then sampled every seconds (the symbol period) to extract the transmitted symbol values and .
This sequence completes the demodulation chain for QAM and ensures that both spectral shaping and ISI suppression are achieved in the receiver.
The IQ demodulator can be visualized as shown in the figure below
Figure: IQ demodulator
Code
Python code for passband qam with rectangular and sinc pulse shaping filter, followed by low pass filtering and matched filtering.
When compared to the transmit symbols, can see that there is a spread in the received symbols. Using raised cosine or root raised cosine filters is a potential approache to mitigate this.
Summary
The post covers the following key aspects
Spectrum of Baseband PAM with a code example
Reduced Spectral Efficiency of Passband PAM
Sending information on orthogonal sine and cosine carriers to improve efficiency (passband QAM)
IQ modulator and corresponding demodulator for Passband QAM with code
Another approach for improving the spectral efficiency of passband PAM is to filter away half the bandwidth (which is not carrying any ‘extra’ information). This is called Single Sideband Modulation (SSB). Anyhow, as I-Q modulation is simpler to implement than circuit for filtering away half the spectrum, I-Q modulation stays. 🙂
Have any questions or feedback? Feel free to drop your feedback in the comments section. 🙂
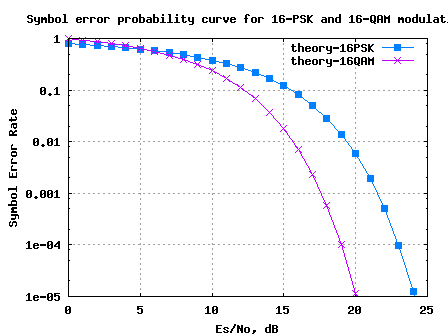
Given that we are transmitting the same number of constellation points in both 16-PSK and 16-QAM, let us try to understand the better modulation scheme among the two, i.e. to answer the following question:
For the same signal to noise ratio , will 16-PSK or 16-QAM give a lower symbol error rate?
When QAM (Quadrature Amplitude Modulation) is used, typically one may find a scaling factor associated with the constellation mapping operation. It may be reasonably obvious that this scaling factor is for normalizing the average energy to one.
This post attempts to compute the average energy of the 16-QAM, 64-QAM and M-QAM constellation (where is a power of 2), thanks to the nice example 5.16 in [DIG-COMM-BARRY-LEE-MESSERSCHMITT].
Consider a typical 16-QAM modulation scheme where the alphabets