Minimum shift keying (MSK) is an important concept to learn in digital communications. It is a form of continuous phase frequency shift keying . In minimum phase shift keying, two key concepts are used.
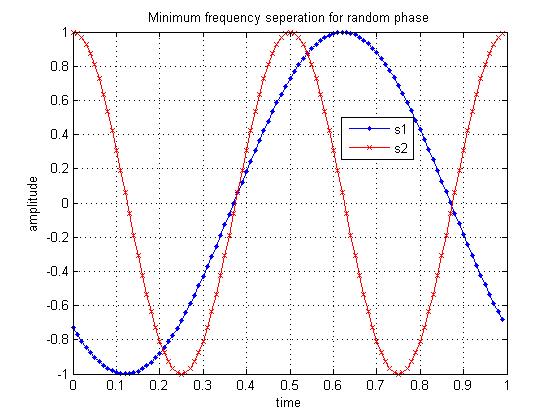
(a) The frequency separation of the sinusoidals used for representing bits 1’s and 0’s are  , where
  is the symbol period.
(b) It is ensured that the resulting waveform is phase continuous.
Motivation of continuous phase
In a previous post (here), we have understood that the minimum frequency separation for two sinusoidals having zero phase difference to be orthogonal is , where is the symbol period. However, it can be observed that at each symbol boundary, there is a phase discontinuity. The presence of phase discontinuities can result in large spectral side lobes outside the desired bandwidth. Hence the need for having a frequency modulated signal which is phase continuous.
Continue reading “Simulating Minimum Shift Keying Transmitter”