Following the discussion on thermal noise and it’s modeling and noise figure computation for a simple resistor network, in this article let us discuss the Noise Figure of cascaded stages.
Definition of Noise Figure
From Section 2.3.2 of RF Microelectronics, Behzad Razavi, the noise figure is defined as
, where
is the input signal to noise ratio and
is the output signal to noise ratio.
Consider that the system has a gain and
is the noise added by the system.
With that,
The Noise Figure is,
.
From the previous post on thermal noise, we know that noise power over bandwidth at temperature
Kelvin is,
.
With that the noise figure equation can be modified as,
.
Two key equations to remember:
a) Noise added by the noise sources in system is,
b) Noise at the output of the system is,
Example
For example, consider a device of bandwidth and having a gain
with noise figure of
. What is the noise power seen at the output of the device?
Solution: Assuming temperature of 300K, the noise seen at the input of the device
.
.
Expressing in deciBels, the noise power seen at the output of the device is,
.
Noise Figure of cascade of two stages
Consider a system with cascade of two gain stages having gains of ,
and with noise figure of
and
respectively.

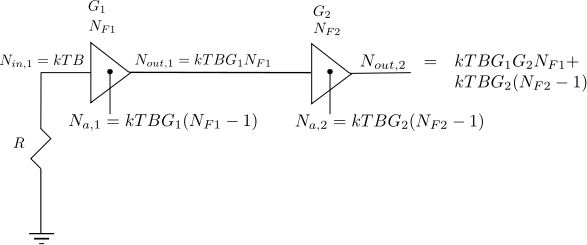
Figure : Cascaded gain stages with noise power output
The noise power at the output of the first stage is the sum of
a) Noise power at the input terminal of first gain stage which is amplified by gain
.
b) Noise power generated by the first gain stage
Summing them up, the noise seen at the output of first gain stage is,
* Note : The sum of powers is possible because it is assumed that the input noise and the noise added by the system are uncorrelated i.e.
, where
when
and
are uncorrelated.
a) Noise power at the input terminal of second gain stage which is amplified by gain
.
b) Noise power generated by the second gain stage
Adding them up, the noise seen at the output of second gain stage is,
.
Equivalent Noise Figure of 2 gain stages
Summarizing, the equivalent noise figure of the two cascaded stage is,
and the equivalent gain is,
Note : All the expressions are in linear terms
Equivalent Noise Figure of n gain stages
Extending this to cascade of stages, the equivalent noise figure is,
.
References
a) Friis, H.T.; , “Noise Figures of Radio Receivers,” Proceedings of the IRE , vol.32, no.7, pp. 419- 422, July 1944


Besides uncorrelation, another condition is required to make E[XY] = 0: the mean of noise E[X] = 0, so E[XY] = E[X]E[Y] = 0 * 0 = 0. Or if X and Y are orthogonal, then E[XY] = 0 for sure.
@Zhang: Yes, thanks for being specific.
Nice article.
This explains why any SMALL adjustments for gain should be attempted on amplifiers(VGA) far away from antenna. At the same time LNA should be the first candidate to adjust the gains in AGC process.
Would be good if you come up with another simple article explaining how the concept of cascaded systems NF is important( or applied) for AGC design.
Thank you
Prem
@Prem: Thanks, will do.