In this post, we will explore a probable way of reducing PAPR (peak to average power ratio) in OFDM by changing the phase of some of the subcarriers. This is in response to the comment to post on Peak to Average power ratio for OFDM, where Mr. Elibom suggested to reduce the PAPR by cyclically rotate some of the subcarriers and using.
Further, the presentation in the IEEE TGN, PAPR in HT-LTF (11-06/1595r1), mentions that in 40MHz mode where a 128pt FFT is used, PAPR of HT-LTF (High Throughput Long Training Field) can be reduced by multiplying the upper 20MHz subcarriers by j. Using quick Matlab simulations, we will try to validate that claim for HT-LTF and further check the PAPR for a general random BPSK and QPSK modulation.
PAPR in HT-LTF
The HT-LTF sequence for the TG-N draft specification is described in page 35 of the Joint Proposal PHY specification document (11-05/1102r4). Note: The specification has evolved considerably over the past 2.5 years (and is not yet publically available), but for discussion on HT-LTF this document should suffice.The peak to average power ratio for a signal is defined as
, where
corresponds to the conjugate operator.
Expressing in deciBels,
.
Matlab/Octave script for computing PAPR in HT-LTF

close all; clear all;

nFFT = 128; nDSC = 114;

% The 128pt HT-LTF sequence for 40MHz as defined in 11-06/1595r4

htLTF = [ zeros(1,6) 1 1 -1 -1 1 1 -1 1 -1 1 1 1 1 1 1 -1 -1 1 1 -1 1 -1 1 1 1 1 1 ...

1 -1 -1 1 1 -1 1 -1 1 -1 -1 -1 -1 -1 1 1 -1 -1 1 -1 1 -1 1 1 1 1 -1 -1 -1 1 0 ...

0 0 -1 1 1 -1 1 1 -1 -1 1 1 -1 1 -1 1 1 1 1 1 1 -1 -1 1 1 -1 1 -1 1 1 1 1 1 ...

1 -1 -1 1 1 -1 1 -1 1 -1 -1 -1 -1 -1 1 1 -1 -1 1 -1 1 -1 1 1 1 1 zeros(1,5)];
x1F = htLTF; % no rotation

x2F = [htLTF(1:64) j*htLTF(65:128)]; % with 90degree rotation
% Taking iFFT, time domain

x1t = (nFFT/sqrt(nDSC))*ifft(fftshift(x1F.')).'; % no rotation

x2t = (nFFT/sqrt(nDSC))*ifft(fftshift(x2F.')).'; % with rotation
% computing the peak to average power ratio for symbol without rotation

meanSquareValue1 = sum(x1t.*conj(x1t),2)/nFFT;

peakValue1 = max(x1t.*conj(x1t),[],2);

paprSymbol1 = peakValue1./meanSquareValue1;

paprSymbol1dB = 10*log10(paprSymbol1)

% computing the peak to average power ratio for symbol with 90 degree rotation

meanSquareValue2 = sum(x2t.*conj(x2t),2)/nFFT;

peakValue2 = max(x2t.*conj(x2t),[],2);

paprSymbol2 = peakValue2./meanSquareValue2;

paprSymbol2dB = 10*log10(paprSymbol2)
As claimed in slide7 of power point presentation PAPR In HT-LTF (11-06/1595r1), the PAPR with
(a) No rotation is 5.6317dB and
(b) With 90 degree rotation is 3.4066dB.
So, around 2.2dB reduction in PAPR is achieved. 🙂
PAPR for random BPSK and QPSK
Armed with the above result, I tried to simulate the PAPR for with random BPSK (and QPSK) modulation on a 128pt FFT with and without rotating the upper 20MHz subcarriers by j.
Click here to download the Matlab/Octave script for simulating PAPR for BPSK/QPSK modulation OFDM with j rotation
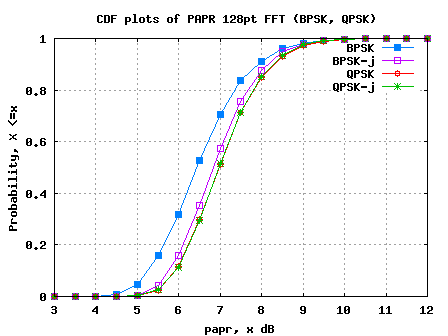
The results from the simulations is shown below.
Figure: OFDM PAPR for BPSK/QPSK with j rotation
Observations
1. For random BPSK sequence, the multiplication by j resulted in increase of PAPR by around 0.5dB.
2. For random QPSK sequence, the PAPR with and without multiplication by j is almost the same.
Based on the above simulation results, may I conclude that there is no noticable reduction in PAPR by multiplying upper 20MHz subcarriers by j. There might be some special cases (like HT-LTF sequence), where the multiplication by j reduces PAPR. However for random BPSK/QPSK sequence, there is no improvement. 🙁


hi could u please help me to design a high power amplifier in ofdm. i need it
@saru: emailed you the instructions
Can u plz help me on the topic of PAPR Reduction by using companding and interleaving..?Can u provide me with the MATLAB Code..????
@Radhika: Sorry, I have not studied that topic.
Hi (Krishna),
First, Thanks for the particularly interesting information about the PAPR for BPSK/QPSK modulation OFDM with j rotation. I am working on PAPR reduction methods for OFDM. Lately I found a method where they use Selected Mapping to reduce PAPR. Did you ever worked with this method and could you give me some instructions how I can implement this in matlab?
Thank you very much.
Kind regards,
Meryem
@Meryem: Sorry, I have not worked on selective mapping algorithm to reduce PAPR.
dear Meryem..(Who ever is interested in SLM) (though its too late but may be some one need it)
Implementation of SLM in matlab is very simple. Just use the code provided, and
1) in place of rotating half of the carriers, rotate all of them with a phasor vector
2) You need to have many phasor vectors (I mean 2- any desired number).
3) After rotation take the IFFT with all the phasor vectors used, and choose the one with the lowest PAR!!!
Its the main idea of SLM.. Moreover, for simplicity u can use phasors which are multiple of pi/2 … or u can use random phasors as well!!
hello
i have some problems in caculating the PAPR of 16-QAM
for example
max_power=max(X.*conjX)
and
mean_power=mean(X.*conjX)
then
papr=min(10*log10(max_power./mean_power))
right?
@Orson: You are right, except that you do not need min in the last step
Also, plz refer to the post @
https://dsplog.com/2008/02/24/peak-to-average-power-ratio-for-ofdm/
sir, In matlab script of computing papr in HT-LTF,
what is the meaning and need of using [],2. please explain the concept
Hai all. I would like to know the fixing/deciding the threshold for PAPR value while finding CCDF for various methods.
@velan: Well, why do you want to have a threshold while plotting the CCDF value?
The detrimental effect of high PAPR, as we know, is due to the non-linear nature of Power amplifiers. In this respect, can you help to incorporate amplifier back-off in to HPA simulation. Just for your reference the following link http://www.mathworks.com/matlabcentral/fileexchange/15331-ofdm-high-power-amplifier-effects
simulates a non-liner amplifer. I will be obliged if you can share your thoughts abou how to incorcorporate output backoff in this code.
Thanks a lot
Ahmed
@Ahmed: Well, to prevent the power amplifier to operate in the nonlinear region, we can reduce the signal power (with the penalty of efficiency) such that the peak of the signal does not cause the PA to move into the non-linear region of operation.
sir
how i can calculate the throughput of WLAN OFDM system
@SREENU: I would recommend you to go over the paper
Throughput and Delay Limits of IEEE 802.11, Yang Xiao, Jon Rosdahl, IEEE COMMUNICATIONS LETTERS, VOL. 6, NO. 8, AUGUST 2002
Its available online and you should be able to find it by quick googling. Good luck.
How can I calculate PSD in Octave? Because it doesn’t cognize pwelch.
@Ricardo: You can download pwelch() from Octave Source Forge
http://octave.sourceforge.net/doc/signal.html#Powerspectrumanalysis
Hi Krishna!
Thanks a lot for your helpful post. I have a query regarding the effect of oversampling on the calculated PAPR. Literature survey shows that a oversampling factor of L=4 is needed to have a true estimation of PAPR. However, I am not finding any such influence. In more details, if I insert N*(L-1)[N is the iFFT size] 0’s in the middle of vector containing the modulated symbol vector (htLTF here) (i.e., oversampling with factor of L)and feed it into IFFT, I find no change in PAPR compared to when no oversampling is done. What I find is that the mean and peak changes but the ratio remains constant. Am I missing something?
Hoping for your response.
Ahmed
@Ahmed sabbir: Sorry, I am also not very well aware for the need for doing oversampling to form a better estimate of PAPR.
Just for an update..I did find difference in the estimation.there was a bug in my previous code I guess.
One request. Can you help to incorporate amplifier back-off in to HPA simulation. Just for your reference the following link http://www.mathworks.com/matlabcentral/fileexchange/15331-ofdm-high-power-amplifier-effects
simulates a non-liner amplifer. Iwill be obliged if you can share your thoughts abou how to incorcorporate output backoff in this code.
Thanks a lot
Ahmed
thank you ver much sir
sorry , i got that thank you very much
sorry, i had one more doubt (is about power spectral density:PSD)
how to calculate PSD And where we will calculate PSD (i.e at Tr. or at Rr.) in MIMO-OFDM.
will you send syntax for PSD (x-axis: freq./bandwidth, y-axis:PSD(dBr) )
thank you very much…………………
@srinivas: We can calcluate PSD at transmit or receive for each antenna in a MIMO link. You can use pwelch for plotting a PSD. For eg, in the post on https://dsplog.com/2008/02/03/understanding-an-ofdm-transmission/, I have used it as
[Pxx,W] = pwelch(st,[],[],4096,20);
where
st – is the time domain wave form
4096 – is the number of points in frequency domain
20 – is the sampling clock
Hi ,dear Krishna, the same question.
our sampling rate is 20 000 000 ,but ,you put in that function you just use 20?why?it really confuse me .
thanks!
Regards
@Michael: Shouldn’t matter, as sampling frequency is notional in matlab
dear sir,
i have one doubt in the above fig: CDF plots of PAPR 128pt(bksk,qpsk),
here PAPR=6.25 ( bpsk ) and PAPR=6.5 (bpsk-j) for CDF=0.4 &
PAPR=5.6 ( bpsk ) and PAPR=6.1 (bpsk-j) for CDF=0.2 etc.. so how we can say PAPR is less in bpsk with j rotation.
please will you give detailed explanation about that and how we can compare PAPR performance with CDF.
thanking you .
@srinu: If you read my observation (stated just below the figure), you can see that
“Based on the above simulation results, may I conclude that there is no noticable reduction in PAPR by multiplying upper 20MHz subcarriers by j. There might be some special cases (like HT-LTF sequence), where the multiplication by j reduces PAPR. However for random BPSK/QPSK sequence, there is no improvement”
Helps?
hi
i have to do academic project “peak–to-average power ratio reduction in OFDM modulation” in Matlab(DSP). Please can you give me the Matlab Code for this project. Please do it.
@srinivas: Good luck for your academic project.
sir,
can u plz tell me wat is the relation between HTLTF and an ofdm signal?
@deepika: HT-LTF stands for High Throughput Long Training Field. Its the name for a preamble symbol used in 802.11n PHY specifications.
noteable reduction in PAPR has been observed in OFDM systems implementing PTS and Selective mapping. Have you tried simulating SLM in matlab?
@jake: Sorry, I have not tried modeling selected mapping for PAPR reduction in OFDM systems
good morning sir id like to give me m file about partial transmit sequence(pts) used to reduce papr in ofdm system and calculation of ber in pts
@ali jaleel taher: Sorry, I have not tried modeling partial transmit sequence for reducing PAPR.
matlab partial transmit sequance (pts)used to reduce papr in of and clippinng method to reduce papr and calculating ber in pts and clliping
@ali jaleel taher: Sorry, I did not follow your question
Sorry, another question, if you add the cyclic prefix (for OFDM), do you calculate the meansquare and peak value after the CP is inserted or before the CP is inserted? Thanks again
@Claire:
Cyclic prefix does not affec the peak value as the cyclic prefix is just a copy of the exisiting symbol. So if a peak valure is present in the cyclic prefix, the same peak value is present in the symbol itself.
For the mean square value also, the cyclic prefix does not make a difference. If we use cyclic prefix for mean square value computation, we need to have a higher value for scaling when computing the mean.
Hope this helps.
Thanks for your help! Your site (and your answers) has been very helpful to understand OFDM and other wireless parameters.
@Claire: Glad to help. 🙂
Hi,
I am wondering why do you do fftshift when taking time domain (in the ifft function)? and also why in the sum and max function, you use the dimension 2? Can I for example replace it with 1? It is for the row isn’t it? Thanks (sorry for the basic question)
@Claire: My replies:
1. fftshift is used for visualizing the fft output. fft out gives a vector with dimesion [0 to 63], however, the values from the indices [32 to 63] correspond to spectrum @ [-32 to -1]. I have written posts on
(a) https://dsplog.com/2007/06/17/interpreting-the-output-of-fft-operation-in-matlab/
(b) https://dsplog.com/2008/08/08/negative-frequency/
Hope the above posts help you understand fftshift().
2. This parameter controls the which dimension of the matrix should be used for finding sum, max. Please refer to the help in matlab.
agh matlab nya ga bs di donlot..
gad isiny..
terlalu sedikit isiny..
the information submitted is very useful for the projects based on papr in ofdm