In the post on Rayleigh channel model, we stated that a circularly symmetric random variable is of the form , where real and imaginary parts are zero mean independent and identically distributed (iid) Gaussian random variables. The magnitude
which has the probability density,
is called a Rayleigh random variable. Further, the phase is uniformly distributed from
. In this post we will try to derive the expression for probability density function (PDF) for
and
.
The text provided in Section 5.4.5 of [ELECTRONIC-COMMUNICATION:PRADIP] is used as reference.
Joint probability
The probability density function of is
.
Similarly probability density function of is
.
As and
are independent random variables, the joint probability is the product of the individual probability, i.e,
.
The joint probability that the random variable lies between
and
and the random variable
lies between
and
is,
.
Conversion to polar co-ordinate
Given that is in the Cartesian co-ordinate form, we can convert that into the polar co-ordinate
where,
and
.
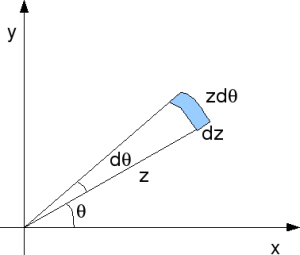
Figure: Cartesian co-ordinate to polar co-ordinate
The area is Cartesian co-ordinate form is equal to the area
in the polar co-ordinate form.
.
Simplifying,
.
Summarizing the joint probability density function,
.
Since and
are independent, the individual probability density functions are,
,
.
Simulation Model
Simple Matlab/Octave simulation model is provided for plotting the probability density of and
. The script performs the following:
(a) Generate two independent zero mean, unit variance Gaussian random variables
(b) Using the hist() function compute the simulated probability density for both and
(c) Using the knowledge of the equation (which we just derived), compute the theoretical probability
density function (PDF)
(d) Plot the simulated and theoretical probability density functions (PDF) and show that they are in good agreement.
Click here to download Matlab/Octave script for simulating the probability density function (PDF) of Rayleigh random variable
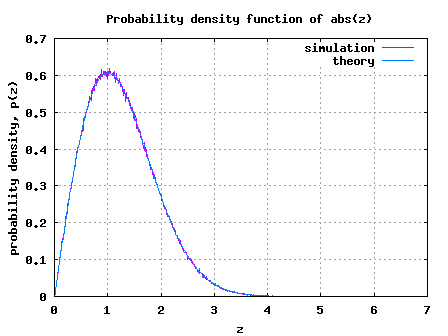
Figure: Simulated/theoretical PDF of Rayleigh random variable
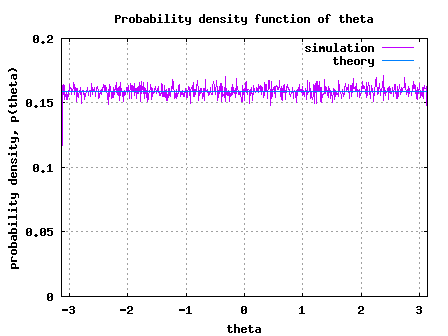
Figure: Simulated/theoretical PDF of uniformly distributed theta random variable
Reference
[ELECTRONIC-COMMUNICATION:PRADIP] Principles of Electronic Communications Analog – Digital, by Pradip Kumar Ghosh
Hi,
I looked at the code and noticed in line 34, when you plot the histogram of the simulated Rayleigh pdf, you divided by 0.01 that is the step of the zBin variable. Is there any intuitive explanation for this? Furthermore, if you sum, approximately integrate, the value for both theoretical pdfs of the Rayleigh distribution you don’t get one. However, if you don’t divide with 0.01 and multiply the theoretical pdf with 0.01 instead, you get one when sum. Maybe this is due MATLAB being not able to purely represent continuous functions? What do you think?
@Sami: Good questions. Am trying to recall why I did it that way… quite likely as you said, it might be due to the continuous vs discrete sample aspect. Will revert back if i find a better explanation…
Thanks again.
Dear Krishna
would you please send me the reference which u use to get this:
h = 1/sqrt(2)*(randn(1,1000) + j*randn(1,1000)) % rayleigh random variable
@mohsen: This is generate complex gaussian noise with zero mean and unit variance.
Hello Krishna,
I am new to matlab. I need some help. Suppose we have ‘Nr x Nt’ MIMO channel matrix.And we assume iid rayleigh fading. So the magnitude of every entry will be rayleigh distributed. Now at the receiver side we have ‘Nr’ receive antennas and at every antenna we will have a set of values for every transmitted symbol. I wish to plot the pdf of the output values. (like the output SNR). How do I find the pdf then ? What kind of pdf will it be ? Further if I have to toss independent and non identical channels how to I do that ? we usually write “(1/sqrt(2))*(randn(Nr,Nt)+j*randn(Nr,Nt))” for a typical unit variance zero mean channel.Please correct me if my understanding is wrong. Any help would be appreciated.
@PeterRay: My replies
a) You can use the histogram (hist function in Matlab) to obtain the PDF.
b) One needs to the write the equations to figure out the nature of the PDF
c) Did you mean, you want to add correlation to the channel coefficients?
Dear Krishna I hope you are doing good !!!
I have question relating to gaussian random variables, i need to plot the pdf of the following:
=summation(from i=0 to i = P) |H^i|²
where H are circularly symmetric complex Gaussian random variables …
I donno how to do it in matlab ,,, kindly help
thanks in advance,
mesange.
@mesange: Hope the following code snippet helps
>>h = 1/sqrt(2)*(randn(1,1000) + j*randn(1,1000)) % rayleigh random variable
>>hP = h.*conj(h); % finding the power
>>hist(hP) % plotting the histogram